Shannon's Index of Diversity
The interpretation an index should always take into account its upper and lower limits. Beisel and Moreteau (1997) illustrate the importance of using a normalized measure. According to the authors, the Hurlbet's form should be used when calculating the Shannon's index of diversity, owing to the fact that the minimum is integrated into the calculation of the index. Nevertheless, even this corrected index may lead to misinterpretations (see below).
The Shannon's diversity index (H), also known as communication entropy, was introduced by Claude Shannon (1948):
where pi is the frequency ni /N.
If the data are in the form of counts, for a given species number (S), and a sample size (N), the minimum (Hmin) and maximum (Hmax) possible values for H can be calculated with the equations
|
|
|
The upper and lower limits of Shannon's diversity index are helpful for the interpretation of data and are useful for calculating an evenness index or a relative diversity index. Two formulations of an adjusted Shannon's index of Diversity may be considered:
|
|
|
|
Pielou's form |
Hurlbet's form |
J does not take into account the Hmin for the given S and N. Therefore misinterpretation errors are frequent when using J (Beisel and Moreteau, 1997).
However, the use of J', can also lead to some misinterpretations. One should be especially careful when using Shannon's index of diversity for comparing populations with different S or N. One obvious example is when the entropy equals the maximum entropy. This happens when all the species have the same number of elements. Consider the populations in Figure 1.
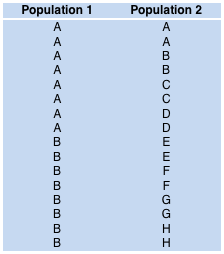 | 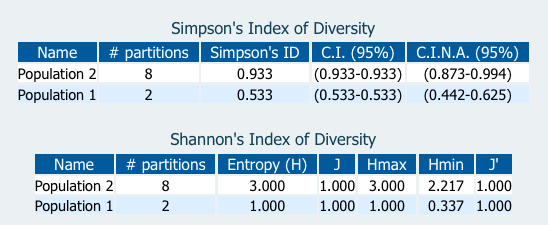 |
In both cases, the entropy equals the maximum entropy (Figure 2). For both adjusted forms (J and J') we obtain 100%. However, one can see that there is more variability in population 2 (number of partitions). We recommend the use of Simpson's index of diversity instead. Simpson's index is 53.3% for population 1 and 93.3% for population 2, reflecting the differences in variability.
For more information about the differences between Shannon's and Simpson's indexes we recommend the reading of Hill (1973). In this paper the total number of species, Simpson's and Shannon's Diversity indexes are presented as particular cases of Rényi entropy (1961). According to this vision, a continuum of possible diversity measures is possible. Those measures provide estimates of the effective number of species present and differ only in their tendency to include or to ignore the relatively rarer species.

