Wallace's coefficient
Wallace's coefficients (Wallace, 1983) can be more informative than Adjusted Rand by providing adirectional information about the partition relation. It can be defined as
where a, b, c and d are the entries in the mismatch matrix.
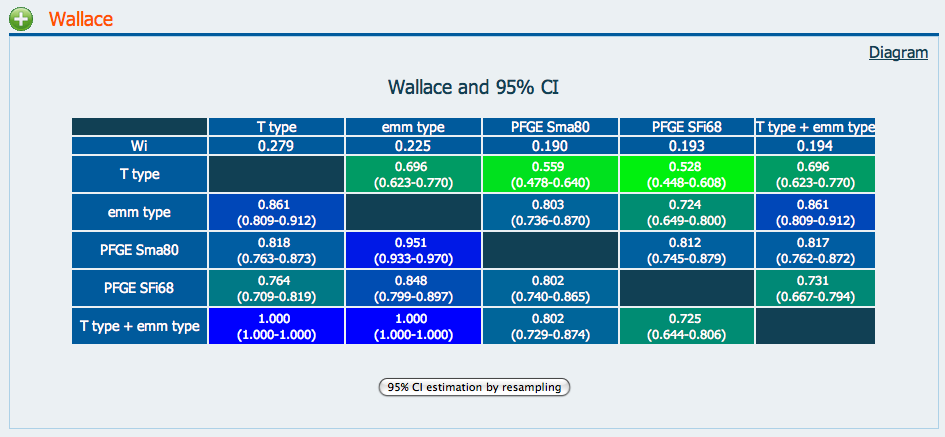
In Figure 1 the results for the Microbial Typing test data set are shown.
 Figure 1
As an example, Wallace PFGE Sma80 → T type = 0.818 and Wallace T type → PFGE Sma80 = 0.559, meaning that if two strains are in the same cluster by PFGE Sma80 they have about 82% chance of having the same T type, while conversely, this is about 56% chance. This reflects the fact that PFGE is more discriminatory than T typing and the PFGE groups subdivide the T types.
Pinto et al. (2008) proposed the use of an analytical confidence interval (CI) for W and the calculation of the expected W value under independence (Wi). Both CI and Wi add statistical support to the comparison of these coefficients. These calculations are also shown in the results table. They reinforce the role of W in generating maps of types or sub-types equivalence between different typing methods, and facilitate the joint analysis of multiple typing methods.
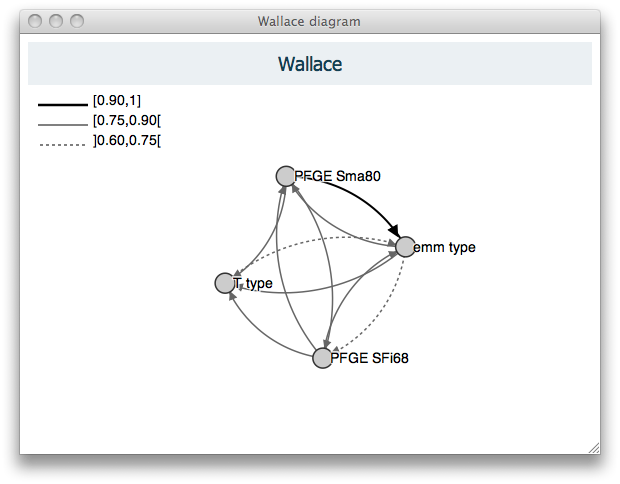
Figure 2 shows an alternate representation of the overall relationships represented in the results table (Figure 1). This diagram represents the stronger relationships between the partitions and may be obtained by cliking "Diagram" when the results are shown.

Figure 2
As reported by Pinto et al. (2008), for W values lower than 0.5, the analytical confidence intervals loose coverage. It was suggested that a CI could be estimated by bootstrap for those cases.
We recently evaluated different jackknife and bootstrap methods for calculation of CIs for W. Our results shown that the jackknife pseudo-values is the most suited method and gives reliable CIs Severiano et al. (2011).
To calculate the jackknife pseudo-values 95% CI, click the button "95% CI estimation by resampling" located bellow the results table. See Jackknife CI for details.
 Figure 3
