How to Format your Data
You can directly copy/paste your data from an Excel/Spreadsheet to the Online Tool.
Your data should be submitted as comma or tab separated values, each column corresponding to a different partition assignment
and each value to a cluster identifier.
You can use alphanumeric characters (0-9, a-z, A-Z) but not special characters (!#$.;?\, etc.).
First row must contain the columns titles. All the columns must be filled in (i.e. no empty values). If there is any missing
data the whole line will be excluded from the comparison and a warning message will be displayed.
Examples:
This example shows a "list" of isolates characterized by three different methods.
The first row contains the methods names. The following rows are the results for each method.
Tab separated text
PFGE	MLST	serotype
1	156	19F
1	162	19A
(..)
Comma separated text
PFGE,MLST,serotype
1,156,19F
1,162,19A
(...)
Copying your data from a spreadsheet:
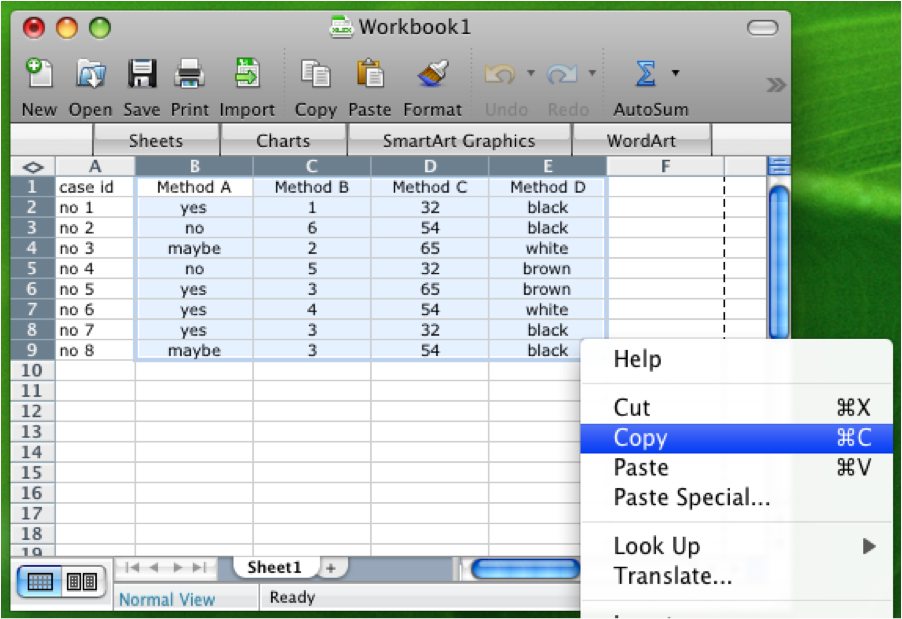
Imagine you had classified 8 items using 4 methods (or criteria) and that you have your results in a spreadsheet (Excel) like in Figure 2.1. To evaluate the congruence between the different methods you just need to follow 4 steps:
1. Select and copy your data, including the methods names:

Figure 1
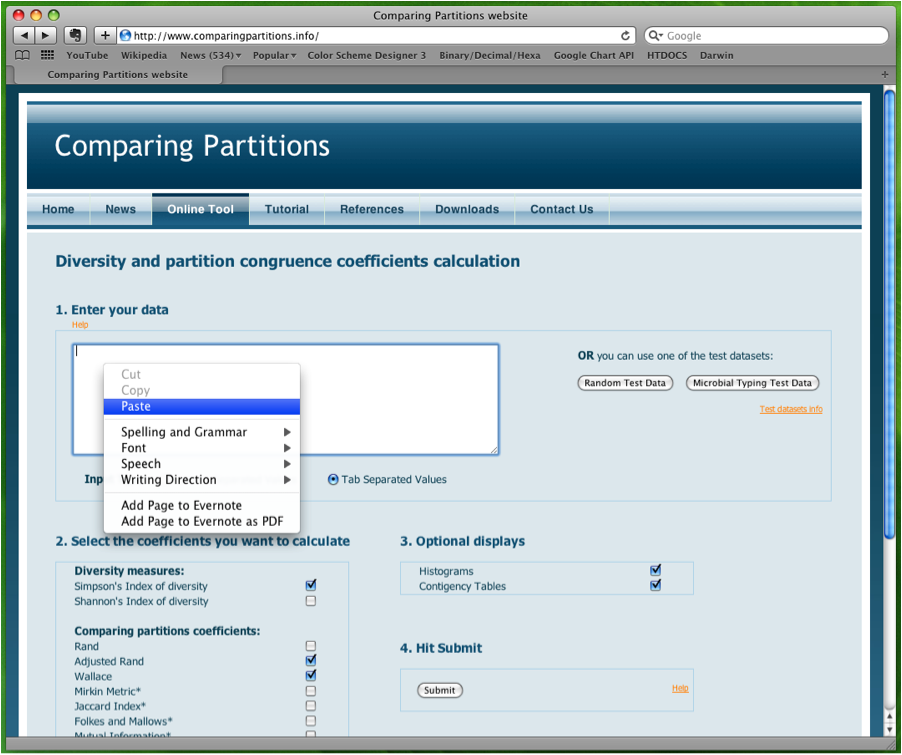
2. Paste it directly into the text area on the site:

Figure 2
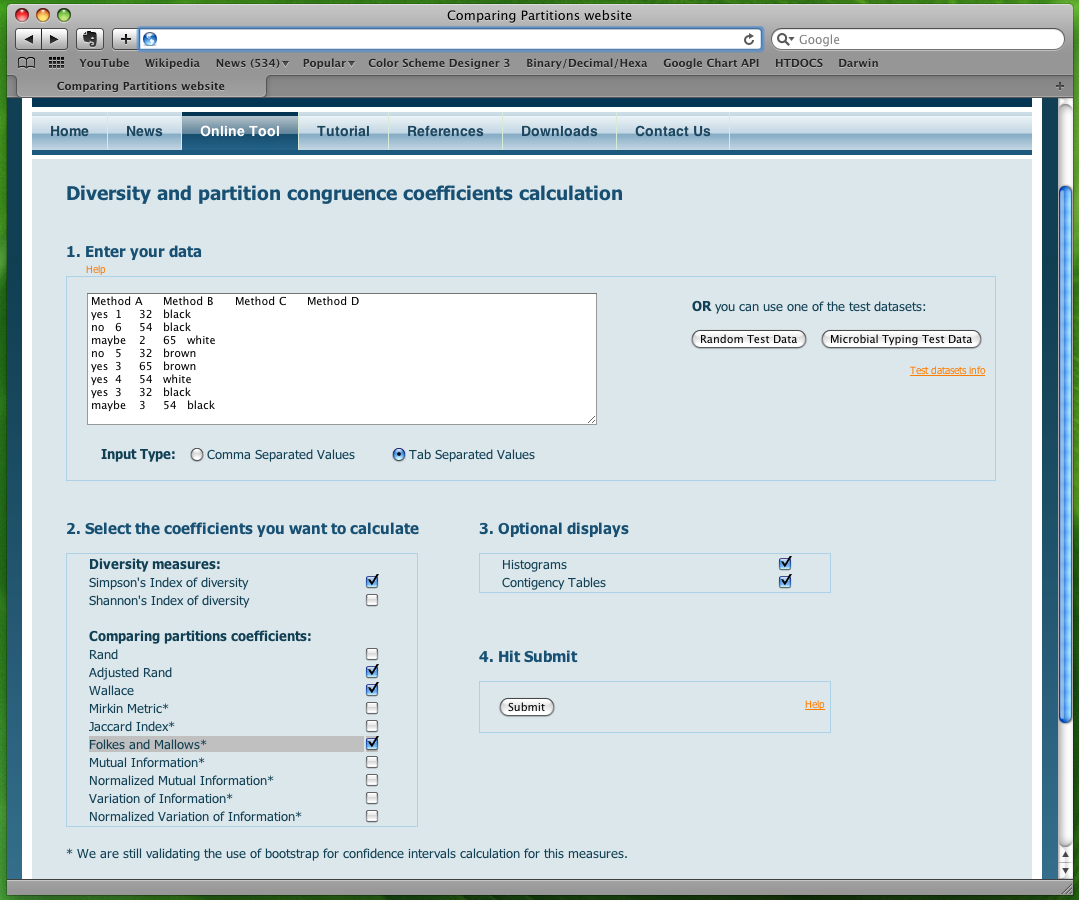
3. Choose which coefficients you want to calculate:

Figure 3
4. Hit the submit button.
And you have your results!

