Rand coefficient
Rand coefficient (Rand, 1971) is here presented but its use for comparing congruence of typing methods is unadvised.
In microbial typing this coefficient is also known as cross-classification coefficient or Typing Method Concordance (J. Versalovic et al.,1993). It is represented by
where a, b, c and d are the entries in the mismatch matrix.
The fact that the Rand coefficient does not take in to account that the two partitions could be generated by chance alone, greatly skew the results for higher values of concordance.
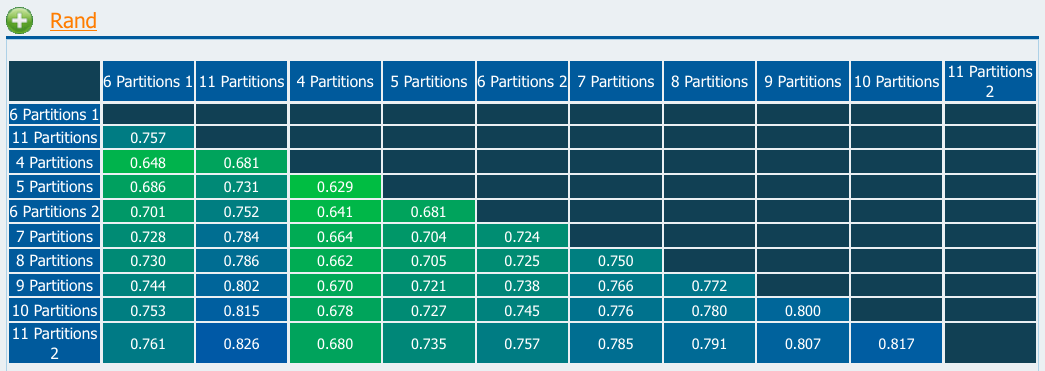
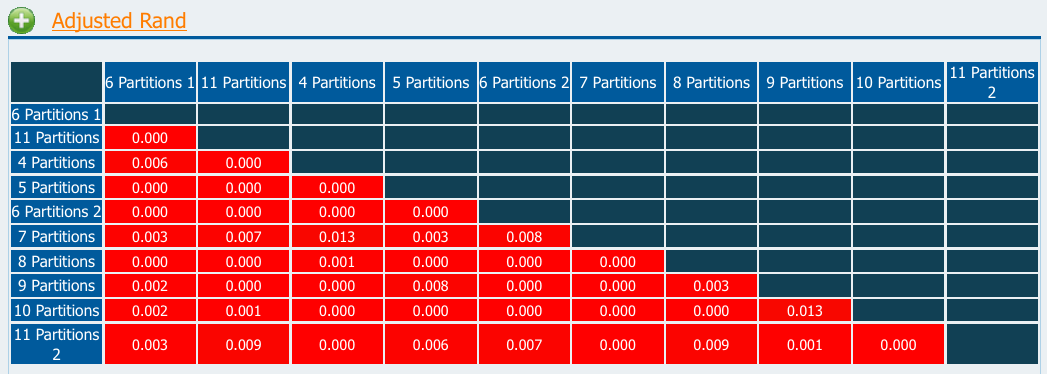
To illustrate this one can use the Random Test Data set and compare the obtained values for Rand and Adjusted Rand coefficients. One can then observe (Figure 1) that Rand coefficient values are high (range 0.629 - 0.826) while Adjusted Rand's are close to 0 revealing the random nature of the partition agreement (Figure 2).
 Figure 1
 Figure 2
In the Online Tool Rand coefficient calculation is not selected by default for the reasons given above.
No analytical formula is available for calculation of confidence intervals (CIs) for the Rand coefficient. However, an approximated 95% CI can be calculated using resampling methods. We recently evaluated different jackknife and bootstrap methods for calculation of CIs for pairwise agreement metrics. Our results shown that the jackknife pseudo-values is the most suited method and gives reliable CIs Severiano et al. (2011).
To calculate the 95% CI click the button "95% CI estimation by resampling" located bellow the results table. See Jackknife CI for details.

